Table of contents
- 🔍 Difference Between Welcome to the Jungle Analytics and ATS Analytics
- 📊 How to Access Recruitment Statistics
- Step 1: Accessing the ATS
- Step 2: Two Types of Consultation
- 📚 Key Metrics in Analytics Advanced
- Candidate Interactions
- Average Response Time
- Average Qualification Time
- Average Disqualification Time
- Average Hiring Time
- 📈 Analysis of Recruitment Stages
- ❓ FAQ – Frequently Asked Questions
You want to optimize your recruitment processes and analyze the effectiveness of your HR actions? The recruitment statistics in Welcome to the Jungle Solutions ATS are essential tools to monitor your performance and make informed decisions. This article guides you on how to access and correctly interpret this data.
🔍 Difference Between Welcome to the Jungle Analytics and ATS Analytics
It is important to clearly distinguish between these two types of analyses: Welcome to the Jungle Analytics ATS Analytics📊 How to Access Recruitment Statistics
Step 1: Accessing the ATS
administrator area.
Step 2: Two Types of Consultation
Option 1 – Analytics by Job Posting Option 2 – Overview
📚 Key Metrics in Analytics Advanced
Here are definitions of the main concepts currently available in analytics advanced :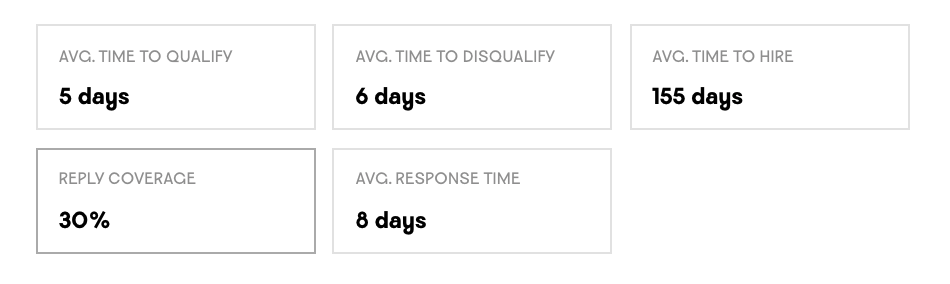
Candidate Interactions
Percentage of candidates who have received at least one email from you (the automatic reply email upon application is not counted).Average Response Time
Average time between the date of an application and the first email sent to the candidate, expressed in calendar days.Average Qualification Time
Average time between the application and its move to a first "positive" stage in the pipeline (any stage except "Rejected"). NoteAverage Disqualification Time
Average time between the application and its move to the "Rejected" column in the pipeline.Average Hiring Time
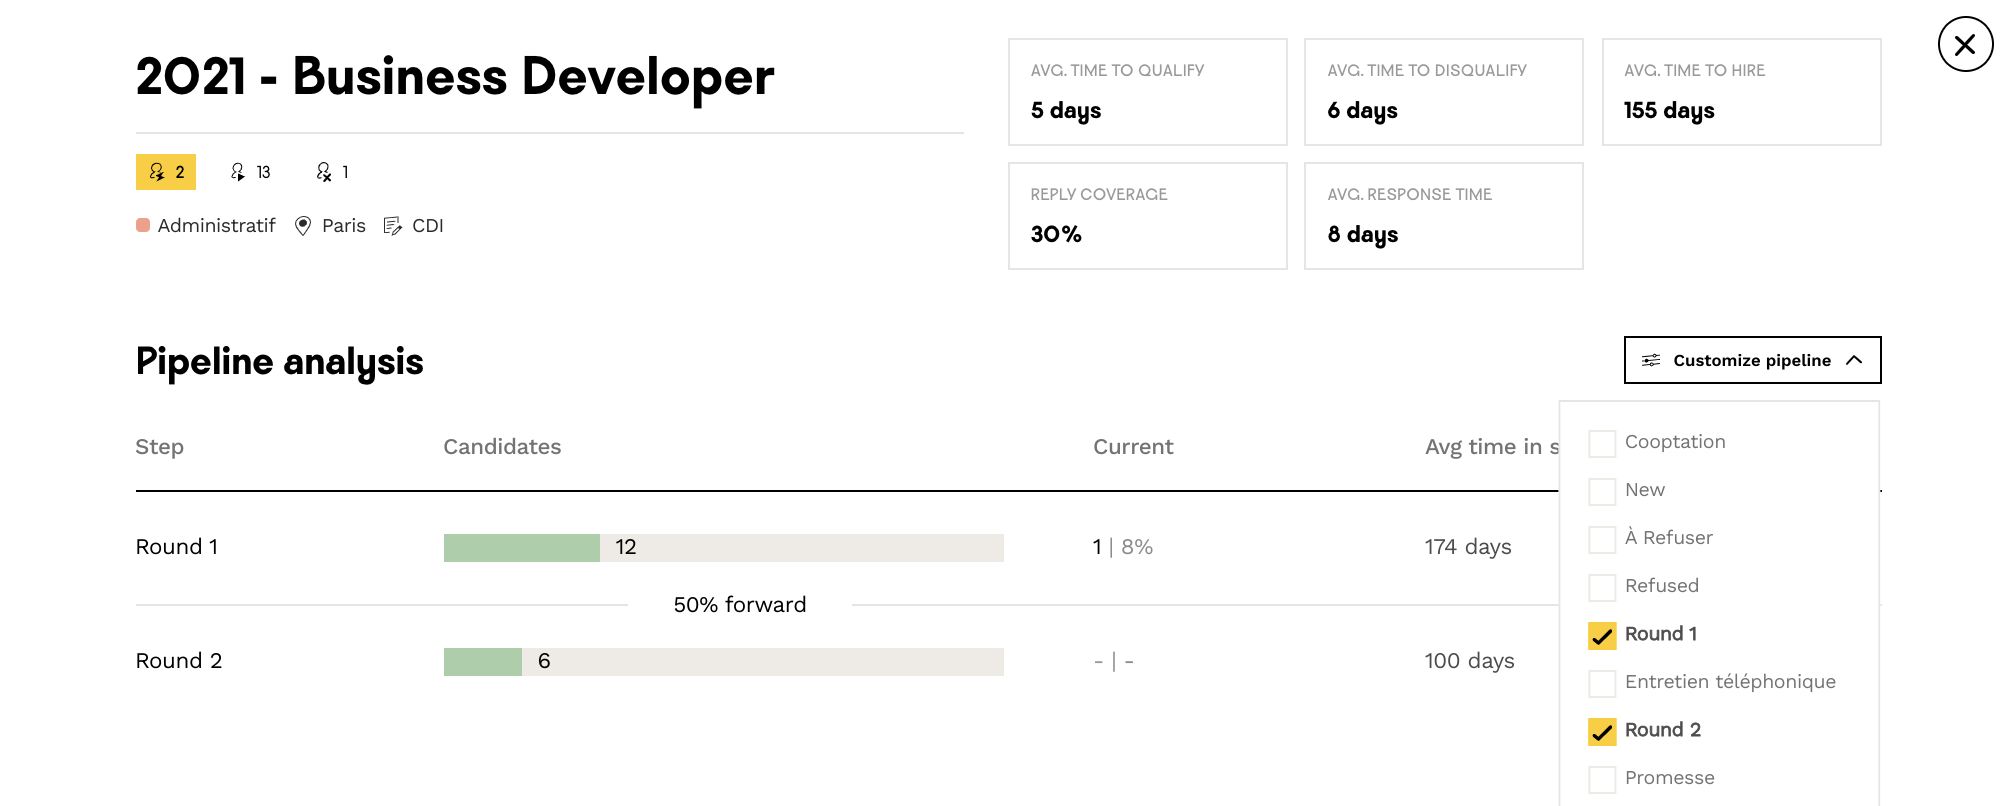
Average time between an application and its move to the "Hired" column, representing the overall hiring time.📈 Analysis of Recruitment Stages
The stage analysis chart allows you to understand in detail how your pipelines work.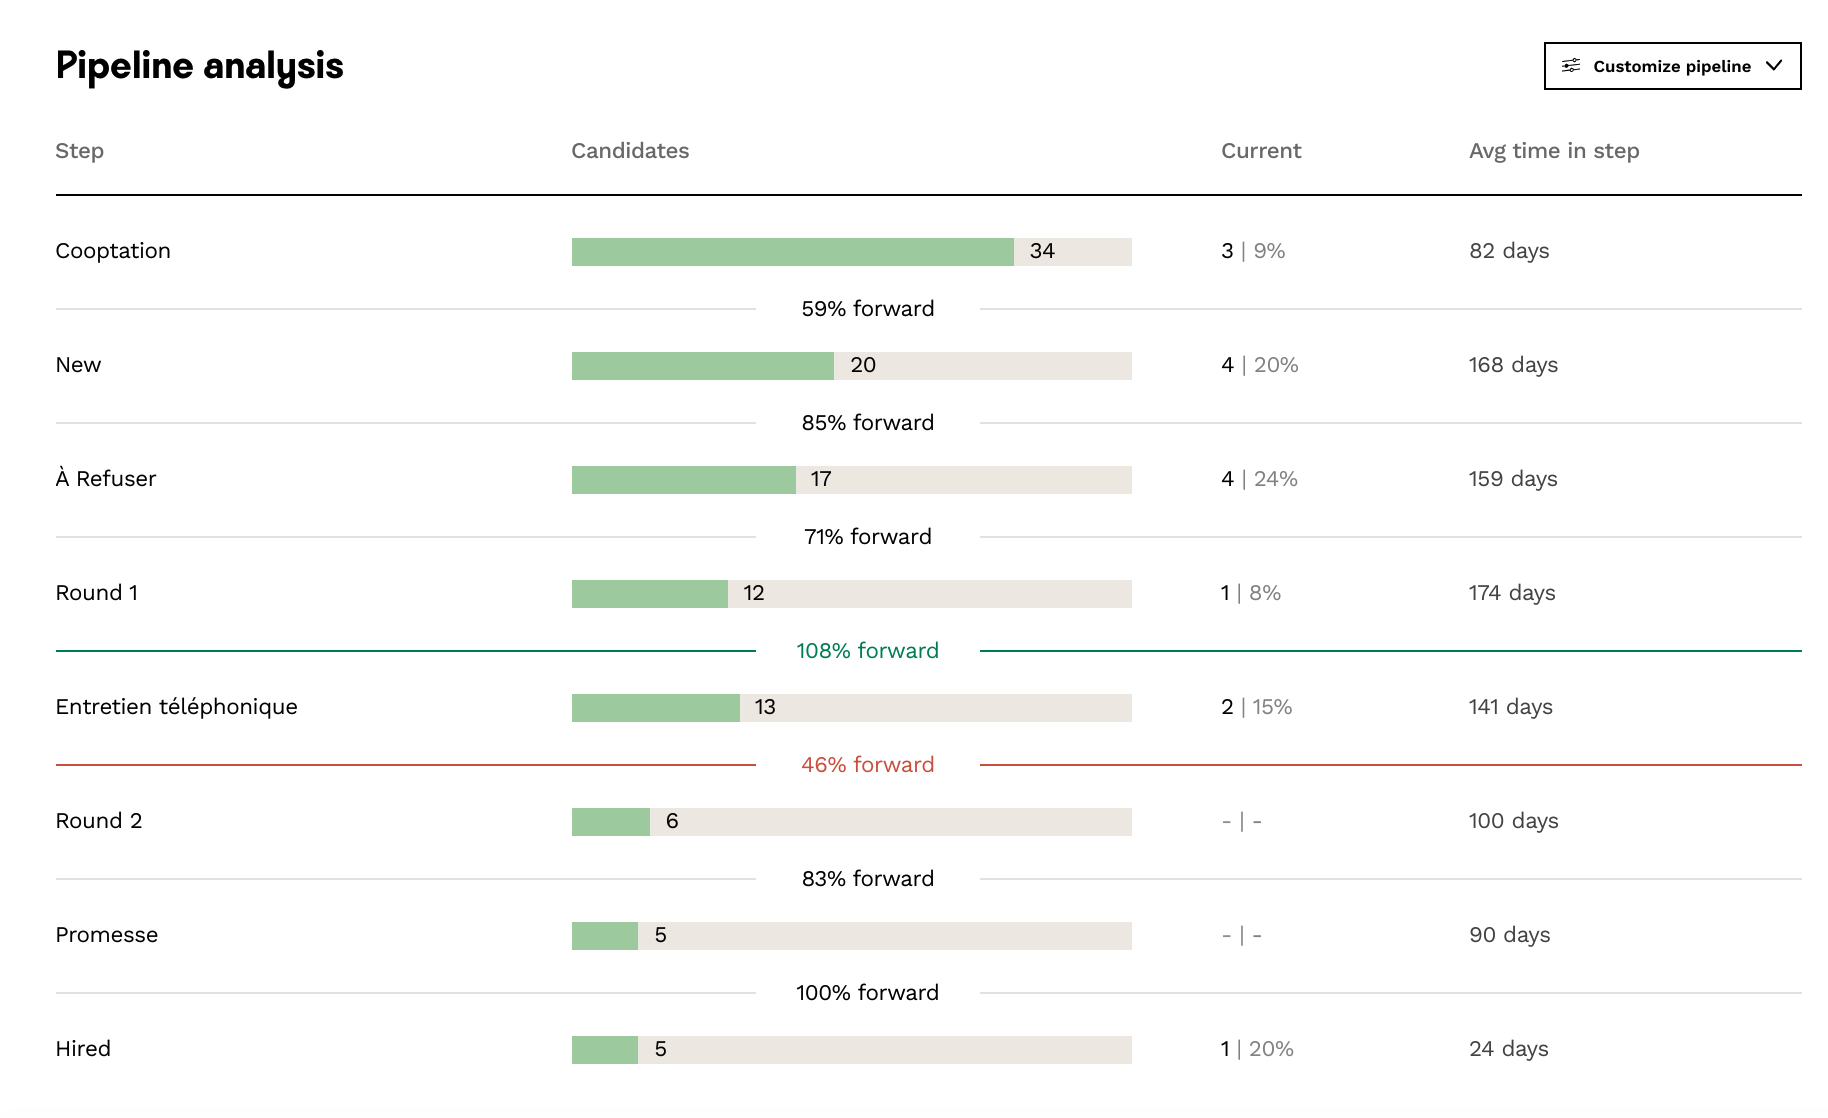 For each stage, you will find:
- The number of candidates who have passed through this stage
- The percentage of candidates who moved to the next stage
- The number of candidates currently in this stage
- The average time candidates spent in this stage